
Although COUNTER reporting is typically the trigger for using LibLynx for analytics, many of our clients use our data pipeline to deliver business intelligence by tracking and reporting on a much broader range of metrics.
A great example of this is the Economist Intelligence Unit (EIU), who needed a comprehensive business analytics solution that could capture a broad range of raw usage-related data from across their platforms and generate information and custom reports to help staff and customers understand user engagement.
The metrics the EIU wanted to track were varied, and not all available in real-time, and so they couldn’t simply be added to our existing real-time COUNTER pipeline. A better solution was for the EIU to upload a comprehensive daily file of events to our platform for automatic ingestion and processing in the LibLynx data pipeline.
Once processed, we combine these metrics with the COUNTER metrics we’re already capturing and generating for them and update a series of custom reports for internal staff, as well as clients. The reports provide product and account managers, and support staff, with granular analysis and observability of usage and other metrics by:
- product and content type
- client cost center code
- individual users
- account type e.g. subscriptions vs trial
- access type e.g. IP address
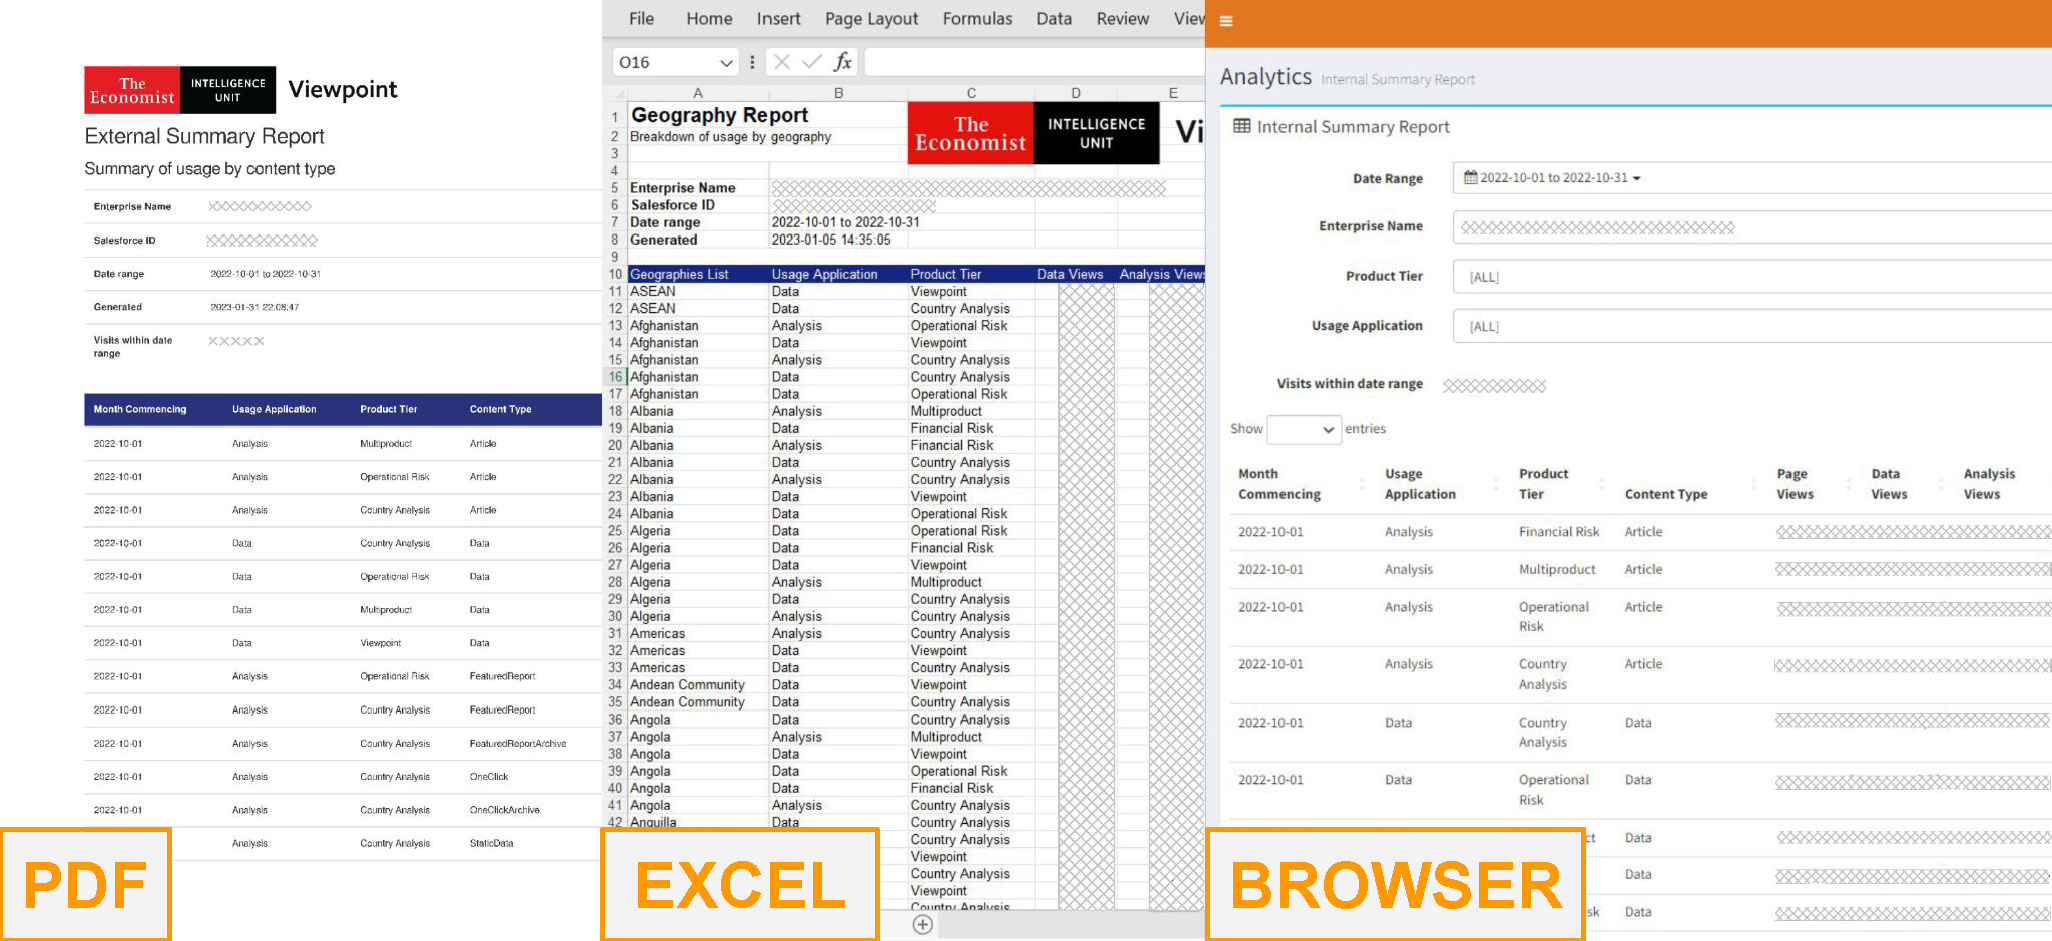
Another important consideration was the audience for these reports. While many of the reports are primarily intended for viewing online, all offer a variety of export options to allow data to be shared internally or externally in appropriate formats (pdf, excel, csv). Branded templates ensure that shared files reflect EIU branding and contain relevant headers and title information.
The result is powerful, on-demand business intelligence delivered directly to the people that need it.
To learn more about how LibLynx can help your organisation understand user behaviour, please contact us, or read our case study on the EIU.